Channel chart patterns are widely used in technical analysis by traders to identify ongoing market trends and reversal points. These patterns form when price movements are confined within two parallel lines, where the lower trendline acts as support and the upper trendline serves as resistance. Depending on the direction of the channel it can signal bullish or bearish trend. An ascending channel suggests an uptrend while a descending channel indicates a downtrend. Recognizing and interpreting channel patterns can help traders make better entry and exit decisions based on price behavior.
In this article, we’ll explore what is channel chart patterns, how channel chart patterns are formed, the different types of channel chart patterns and how to trade channel chart patterns.
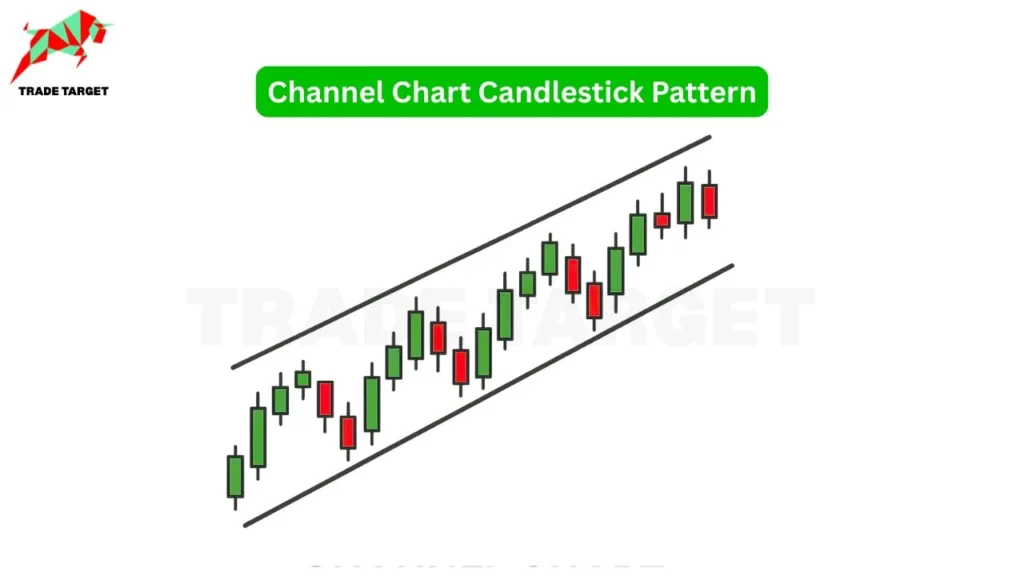
A channel chart pattern is a widely used technical analysis pattern that helps traders identify the trend direction and momentum of the security. This pattern is formed by two parallel trendlines, one connecting the highs (resistance) and the other connecting the lows (support), which create a price channel in which the asset moves.
Channel patterns are used in analyzing both trend continuation and trend reversal scenarios. When price action consistently respects these boundaries, traders anticipate either a breakout above resistance or a breakdown below support, using the pattern to determine entry and exit points.
Channel chart patterns can appear in various forms, such as ascending channels (bullish), descending channels (bearish) and horizontal channels (sideways trends). These patterns are applicable across different timeframes making them versatile for day trading, swing trading and long term investing strategies.
What is Triple Top Chart Pattern & How Does It Work?
Below are the key characteristics that define this pattern:
Parallel Trendlines: Price oscillates between two parallel lines, forming a price channel. These lines act as support & resistance levels helping traders visualize price direction and structure.
Price Reactions: Price respects these support and resistance bouncing between upper resistance and lower support. This repetitive movement makes price action within the channel more predictable allowing traders to plan entries and exits.
Trend Implications: A channel chart pattern can signal trend continuation and reversal depending on whether the price breaks out above the resistance line or below the support line.
Applicability Across Market Phases: One of the strengths of the channel pattern is its flexibility. It can form during uptrends, downtrends or sideways markets, making it a valuable pattern in various trading scenarios.
Time Frame Independence: Channel patterns can appear on any time frame, intraday, daily or weekly charts, making it suitable for all types of traders from scalpers to long term investors.
A channel chart pattern forms when the price of a security moves consistently between two parallel trendlines either upward, downward or sideways. This pattern forms after a clear directional move, followed by a phase where the price action respects these parallel boundaries.
In a bullish or ascending channel, the price creates a sequence of higher highs and higher lows indicating an uptrend. On the other hand, a bearish or descending channel is formed by lower highs and lower lows, signaling a continuing downtrend. These trendlines act as support and resistance levels that guide the overall movement.
The formation becomes more reliable when multiple price touches occur at the upper resistance and lower support lines without a breakout. Traders use this behavior to anticipate breakouts or reversals when the price nears the channel boundaries.
Understanding how a channel chart pattern forms is important for technical analysis, as it helps traders identify entry and exit points, manage risk and predict future price direction with confidence.
Types of Channel Chart Patterns
Channel chart patterns are broadly categorized into 3 types, bullish, bearish and horizontal channels. Each type reflects different price movements & offers insights for traders using technical analysis.
A bullish channel pattern forms when an asset’s price consistently creates higher highs and higher lows, resulting in an ascending channel. This pattern signals buying interest and a prevailing uptrend in the market.
The ascending channel chart pattern is defined by two parallel trend lines, an upward sloping support line connecting the higher lows and a resistance line connecting the highs. Traders look for buying opportunities near the support line, setting stop loss orders just below the lower boundary to manage risk. As prices approach upper resistance line, traders look for profit booking.
Bearish Channel Pattern
A bearish channel pattern known as a descending channel forms when the price makes lower highs and lower lows, forming a downward sloping channel. This signals continued selling pressure and a strong downtrend.
In this scenario, traders may consider short selling near the resistance line, with proper risk management through stop loss placements above the upper trend line. Since false breakouts are common.
Horizontal Channel Pattern
A horizontal channel pattern or sideways channel occurs when price moves within parallel support and resistance levels without a clear trend. This pattern appears during market consolidation reflecting a balance between buyers and sellers.
However, the direction of the breakout is uncertain, so traders rely on volume analysis or other technical indicators for confirmation. Trading within the channel involves buying near support and selling near resistance until a breakout is confirmed.
Trading a channel chart pattern involves analysing the price movement within parallel trend lines, acting as support and resistance. These patterns help traders identify entry and exit points, as well as anticipate breakouts or reversals.
Stop Loss Strategy: Risk management is important when trading channel patterns. Placing a stop loss order just beyond the channel boundaries protects against unexpected breakouts.
In a bullish channel pattern, stop loss is set slightly below the lower trendline helping to prevent large losses if the price breaks downward.
In a bearish channel pattern, stop loss is placed just above the upper trendline, acting as a safeguard against false breakouts on the upside.
Setting Targets: A well defined price target is key to profit booking in channel pattern trading. It is calculated by measuring the channel height (distance between the upper and lower boundaries) and projecting it from the breakout level.
In a bullish breakout, the target is set by adding the channel height to the breakout point above the upper resistance.
In a bearish breakout, the target is estimated by subtracting the channel height from the breakdown point below the support level.
Example
Consider a stock moving within a rising channel chart pattern, where the price repeatedly touches and rebounds from support and resistance lines.
A trader might:
Buy near the lower trendline, anticipating a bounce from support.
Exit near the upper trendline or prepare to short if reversal signals appear.
Such strategies work best when the pattern is confirmed with volume or other indicators.
Channel chart patterns help traders understand market trends and spot trading opportunities. Whether it’s a bullish, bearish or sideways channel, knowing how these patterns form can improve your trading decisions.
By combining analysis with proper risk management, like using stop losses and setting targets, traders can reduce uncertainty and trade more confidently.
Frequently Asked Questions
What is a straight channel pattern?
A straight channel pattern, also known as a horizontal or sideways channel, shows price fluctuating between flat support and resistance lines indicating market consolidation or indecision.
How reliable are channel patterns in predicting price movements?
Channel patterns offer moderate reliability, they help identify trends and potential breakouts but should be used with other indicators for confirmation and risk management.
What is the rising channel pattern?
A rising channel pattern forms when price moves between two upward sloping lines, indicating a steady uptrend with higher highs and higher lows, used in bullish markets.
Can channel patterns be applied to different timeframes?
Yes, channel patterns work across timeframes, daily, weekly or intraday. Shorter timeframes suit active traders, while longer timeframes are useful for swing or positional trading.
How do traders utilise channel patterns for decision making?
Traders use channel patterns to identify entry and exit points, set stoploss levels and forecast breakouts or reversals by analyzing price behavior within the channel.
Happy investing and thank you for reading!
Disclaimer: This website content is only for educational purposes, not investment advice. Before making any investment, it’s important to do your own research and be fully informed. Investing in the stock market includes risks, and you should carefully read the Risk Disclosure documents before proceeding. Please remember that past performance doesn’t guarantee future results, and due to market fluctuations, your investment goals may not always be achieved.